
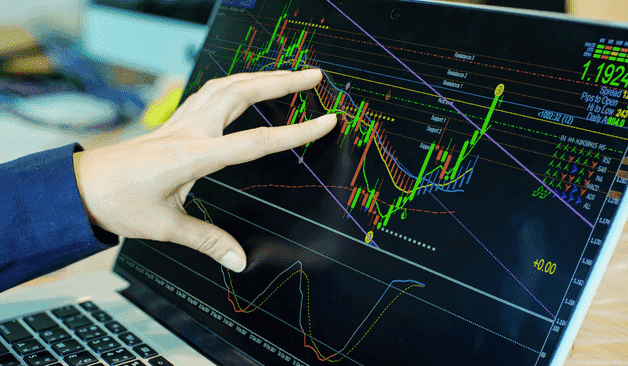
Financial markets move quickly, often driven by waves of sentiment, news, and shifting expectations. For traders trying to interpret this constant flow of information, charts offer a powerful way to translate market activity into meaningful insights. Technical analysis has emerged as one of the most widely used methods for understanding price movements and identifying potential trading opportunities.
At its core, technical analysis focuses on studying historical price data and trading volume to forecast future market behaviour. Rather than examining company earnings or economic fundamentals, it concentrates on patterns within price charts, believing that market behaviour often repeats itself over time. This practical approach allows traders to spot trends, determine entry and exit points, and manage risk more effectively. Understanding tools such as candlestick charts, trendlines, and indicators can transform a trader’s perspective on the market and create a structured framework for decision-making.
Understanding the Foundations of Technical Analysis
To appreciate the power of chart-based trading, it helps to start with the basics. Technical analysis is a method used to evaluate financial markets by studying past price movements and statistical patterns in trading activity.
For traders looking to build a deeper understanding of the concept, learning what is technical analysis can provide valuable context on how these methods are applied across different financial markets.
Unlike fundamental analysis, which examines financial statements or macroeconomic conditions, technical analysis assumes that all relevant information is already reflected in the price. In other words, the market itself becomes the primary source of insight. Price trends, trading volume, and historical patterns form the foundation of analysis.
The Role of Candlestick Charts in Market Analysis
Among the many tools used in technical analysis, candlestick charts are perhaps the most recognisable and widely used. These charts provide a visual representation of price movement during a specific time period.
Each candlestick tells a story about market activity. It displays four key pieces of information: the opening price, the closing price, the highest price reached, and the lowest price reached within a given timeframe. These elements combine to create the candle’s body and wicks, which visually illustrate how buyers and sellers interacted during that period.
For traders, candlestick charts offer more than just raw data. They reveal market sentiment. A long bullish candle may indicate strong buying pressure, while a bearish candle suggests sellers are dominating the market. When multiple candles form recognisable patterns, traders can begin to identify possible trend reversals or continuation signals. Patterns such as doji candles, hammers, and engulfing formations often signal momentum shifts. While no pattern guarantees a particular outcome, these signals help traders anticipate potential changes in price direction.
Moving Beyond Candles with Technical Indicators
While candlestick charts provide valuable visual insights, many traders combine them with technical indicators to strengthen their analysis. Indicators are mathematical calculations based on historical price or volume data that help identify trends, momentum, and potential reversal points.
Some of the most commonly used indicators include moving averages, the Relative Strength Index (RSI), and the Moving Average Convergence Divergence (MACD). Each indicator focuses on a specific aspect of market behaviour. Moving averages smooth out price data to highlight the underlying trend, while oscillators such as RSI measure whether an asset may be overbought or oversold.
Another essential concept within indicator-based analysis is support and resistance. These levels represent price zones where buying or selling pressure tends to increase. Support often acts as a floor where prices may bounce upward, while resistance functions as a ceiling that can halt upward momentum. Indicators should not be used in isolation. Experienced traders often combine several tools to confirm signals before entering a position. For example, a trader might identify a bullish candlestick pattern near a support level while also observing a momentum indicator turning upward. When multiple signals align, the probability of a successful trade may increase.
Turning Analysis into Practical Trading Decisions
The true power of technical analysis lies in its ability to transform raw market data into actionable insights. By interpreting chart patterns and indicators, traders can develop structured strategies for entering and exiting trades.
One practical advantage of technical analysis is its adaptability. It can be applied to virtually any liquid market, including stocks, forex, commodities, and cryptocurrencies. Because it focuses on price behaviour rather than company fundamentals, the same analytical tools can work across different asset classes.
Technical analysis also helps traders manage risk. By identifying support and resistance levels, traders can place stop-loss orders at logical points on the chart. This helps limit potential losses while allowing profitable trades room to grow.
Conclusion
Technical analysis remains one of the most practical and widely used approaches to navigating financial markets. By studying historical price data, traders gain valuable insights into trends, market sentiment, and potential turning points. Tools such as candlestick charts provide a visual language for interpreting price behaviour, while indicators add quantitative depth to the analysis.
The journey from understanding simple candlestick patterns to integrating advanced indicators represents an important step in a trader’s development. As traders gain experience, these tools become more than just chart features. They become part of a structured decision-making process that helps manage risk, refine strategy, and identify opportunities.